Strategy
Social media strategy mistakes: reach versus real outcomes for business teams
Reach numbers hide weak results. Learn the measurement error behind most social media strategy mistakes and how to report outcomes, cost per action and context.
What to take away
- Reach counts how many accounts saw a post. It does not count how many bought, booked or subscribed.
- Choose one business action per campaign and one number that proves the action happened.
- Report reach, qualified reach, conversion rate and cost per outcome in the same weekly table.
- Vanity metrics still have a job. They explain an outcome, they do not replace one.
Why reach and outcomes drift apart on social platforms
Social platforms rank and report on attention because attention keeps people on the app. Impressions, reach, video views and follower counts are cheap to produce and easy to inflate.
A boosted post can reach far more people than a plain post and still produce no sales. A smaller post that answers a buyer question can produce several demo requests. Counting the wrong number hides which one worked.
Teams inherit this bias from their dashboards. The graph that moves every day is reach. The graph that moves the bank account moves slowly, so it gets ignored.
A reporting table that separates reach from revenue
| Metric | What it answers | Where it belongs |
|---|---|---|
| Reach | How many accounts saw the post | Context for a result |
| Saves and shares | Did the post earn attention | Context for a result |
| Qualified reach | How many matched the target profile | Mid funnel check |
| Conversion rate | How many acted after seeing it | Primary outcome |
| Cost per outcome | What each action cost in ad spend | Budget decision |
Conversion rate measures the share of people who complete the wanted action. It deserves the top row of a board report, with reach underneath as the explanation.
Social media analytics defines how each platform counts impressions, reach and engagement. That definition matters when two dashboards disagree about the same week.
Five steps to fix the measurement error
- Write the outcome as a business action, such as a booked call, a trial start or a store visit.
- Pick one primary metric that proves the action happened, plus one cost metric for budget.
- Tag every campaign link so the platform number and the analytics number can be compared.
- Set a reporting window long enough for the action, often 14 to 30 days after first touch.
- Review the gap between reach and outcome each month, then cut creative that adds reach without action.
Steps three and four carry most of the weight. Without tagging, the outcome number stays a guess. Without a fair window, cheap actions win by default.
Example: a ten person clinic rebuilds its weekly report
A small physiotherapy clinic posted daily and reported strong impression growth. Bookings had not moved for two quarters.
The team replaced the impression goal with one outcome: completed new patient assessments. They tagged booking links, waited 30 days, and counted assessments per campaign.
The weekly report became five rows: spend, reach, qualified reach, assessments booked and cost per assessment. Reach stopped being the headline.
The owner could then ask a useful question. Which creative produced assessments at a cost we can repeat?
Benchmarks and the vocabulary trap
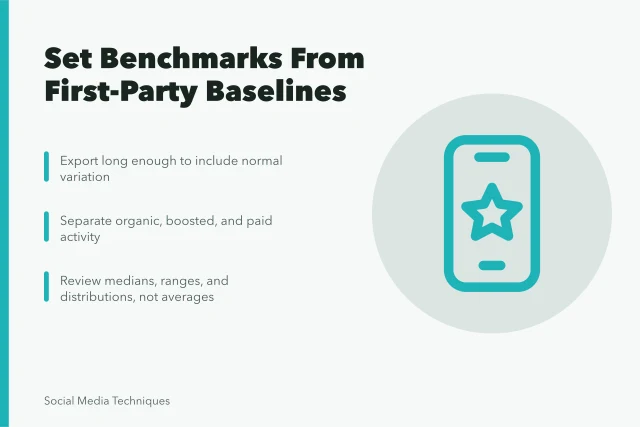
Benchmarks copied from other accounts fail because platforms define terms differently. A view on one app may mean three seconds, and on another it may mean a full play.
Fix the definitions in writing before comparing months. Then the report shows whether a change came from reach, from conversion or from pricing.
Engagement is the weakest word in the set. It mixes comments, saves, shares and clicks into one number that no budget line can use.
Governance duties that keep the report honest
One person should own the weekly outcome figure, with a named backup. That person checks tags, windows and definitions before the numbers circulate.
Teams that publish in both official languages carry extra review steps. Bilingual social media management Ottawa Montreal differs on French review and staffing, so compare both cities before choosing a workflow.
Creator partnerships add the same confusion. Paying for reach is not the same as paying for sales, and FTC guidance on social media endorsements sets disclosure duties for sponsored posts.
A full planning process with goals, audience evidence, platform roles and review cycles is set out in social media strategy for business teams.
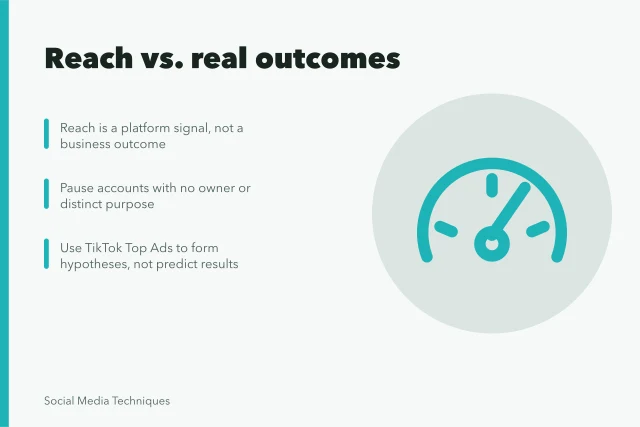
The wider set of errors, including vague goals, platform sprawl and weak evidence, appears in reach versus real outcomes, which surveys several mistakes rather than fixing this one.
Common questions
How do I know if reach is the wrong metric?
If the campaign goal is a booking, a sale or a signup, reach only explains volume. Check whether the outcome moves when reach moves. If it does not, demote reach to context.
Which metrics should stay on the weekly report?
Keep one outcome metric, one cost metric and two context metrics such as reach and saves. Delete anything nobody can act on.
How long should the reporting window be?
Long enough for the buyer to act, often 14 to 30 days from first touch. Short windows flatter fast, cheap actions.
Do creator posts change the measurement?
Yes. Sponsored reach arrives with disclosure duties, and sales often land later. Track creator campaigns over a longer window than owned posts.